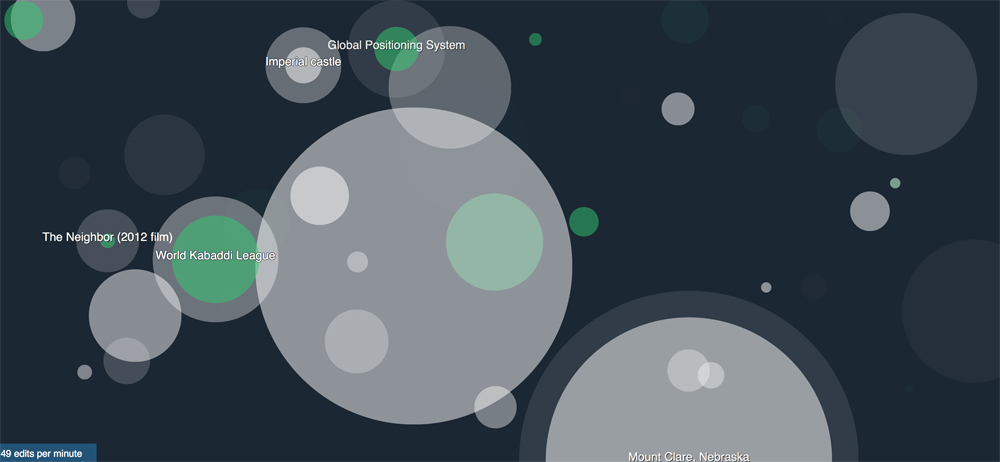
Have you ever looked at a large table of data or some uninspiring, unreadable chart or graph and wondered what it was about? Have you thought whether what you’re looking at is telling the real story or selectively representing data to make a particular point or emphasis? Does the data look confusing or just plain […]

